Blog
ELM Data Analytics and the Insurance Industry
Published by Philip Knight on Jan 04, 2017

ELM data analytics is a very hot topic in the insurance industry right now. Actuarial tables have been the mainstay of risk assessment and management for hundreds of years but there is now an awareness that the vast repositories of data, collected internally over many years and augmented by business acquisition, can be used for the benefit of insurers to drive awareness of profitability, trends, leakage, company efficiency, TPA performance, risk responsiveness and adherence to regulatory requirements.
For more traditionally-based insurers, there is the threat of increased competition from emerging economies and internet-based firms, a reliance on inefficient forms of claims handling and settlement and increasing litigation costs.
Data analytics can certainly crunch the numbers but does it produce meaningful MI? A mass of grids and tables will only serve to confuse all but the dedicated data junkies and having to sift through and decode only delays and/or loses pertinent information. Let’s say you are an insurer using a number of TPAs with delegated authority and they are supplying you with the data you have requested, on a regular basis. I know, but bear with me. The data may be shared in a variety of formats, some may be missing due to legacy constraints, or other reasons. All of it has to be combined, cleaned, checked, manipulated, and presented in the report formats required and made available to appropriate people.
Ideally, data visualization and the ability to drill down/manipulate the presented reports will be the end product, making it easy for the viewer to see and understand their reports, view trends, track spend and performance and make leadership or business decisions.
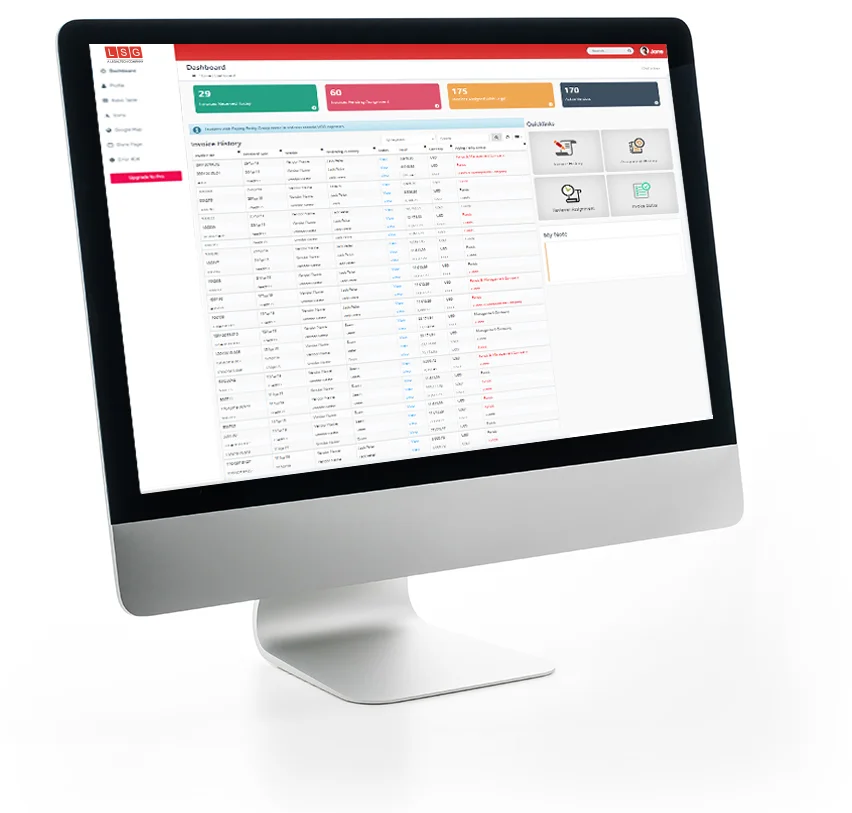
Providing this can be quite a tall order and this is where a solution like ELM Data Analytics will help. Client-specified, configurable reports are provided, with rich visualizations that include features that enable, for example, filtering by line of business or location, which adjusts all other associated visual displays. In addition, client-approved viewers can have the ability to create their own reports, quickly and simply.
Data analytics should be all about visibility, understanding and the provision of information that enables and supports business decisions. Why not explore what we can do together?
Philip Knight spent over 20 years as an independent consultant in project management, planning, design and training in fields as varied as public broadcasting, car manufacture, insurance and finance before joining LSG.
After contributing to LSG as Director of Product Development, Director of Performance and Quality, Director of Programmes and Chief Product Officer he now occupies the role of interim CEO.


